Requirements
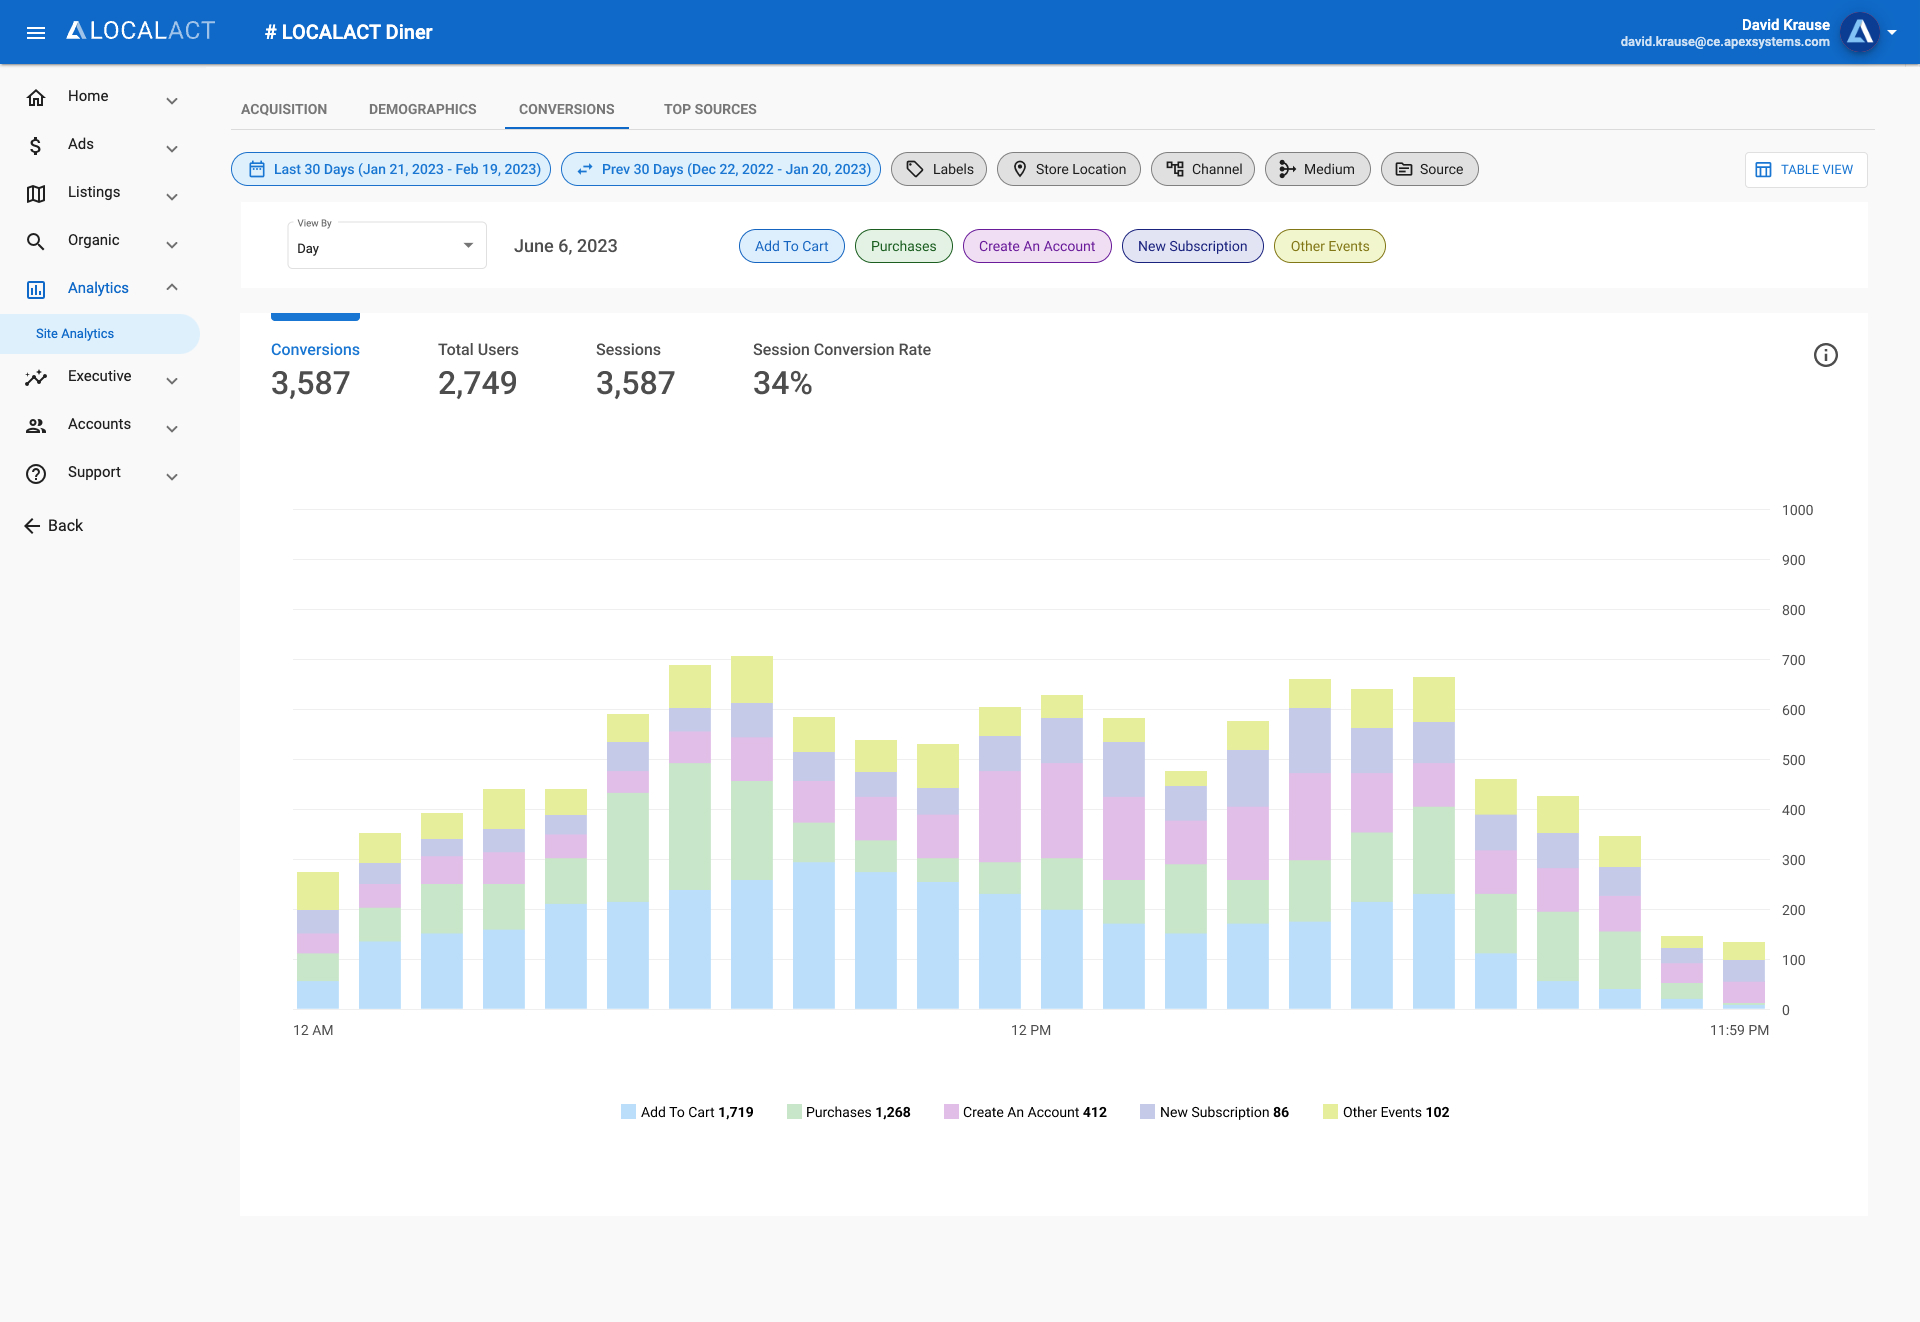
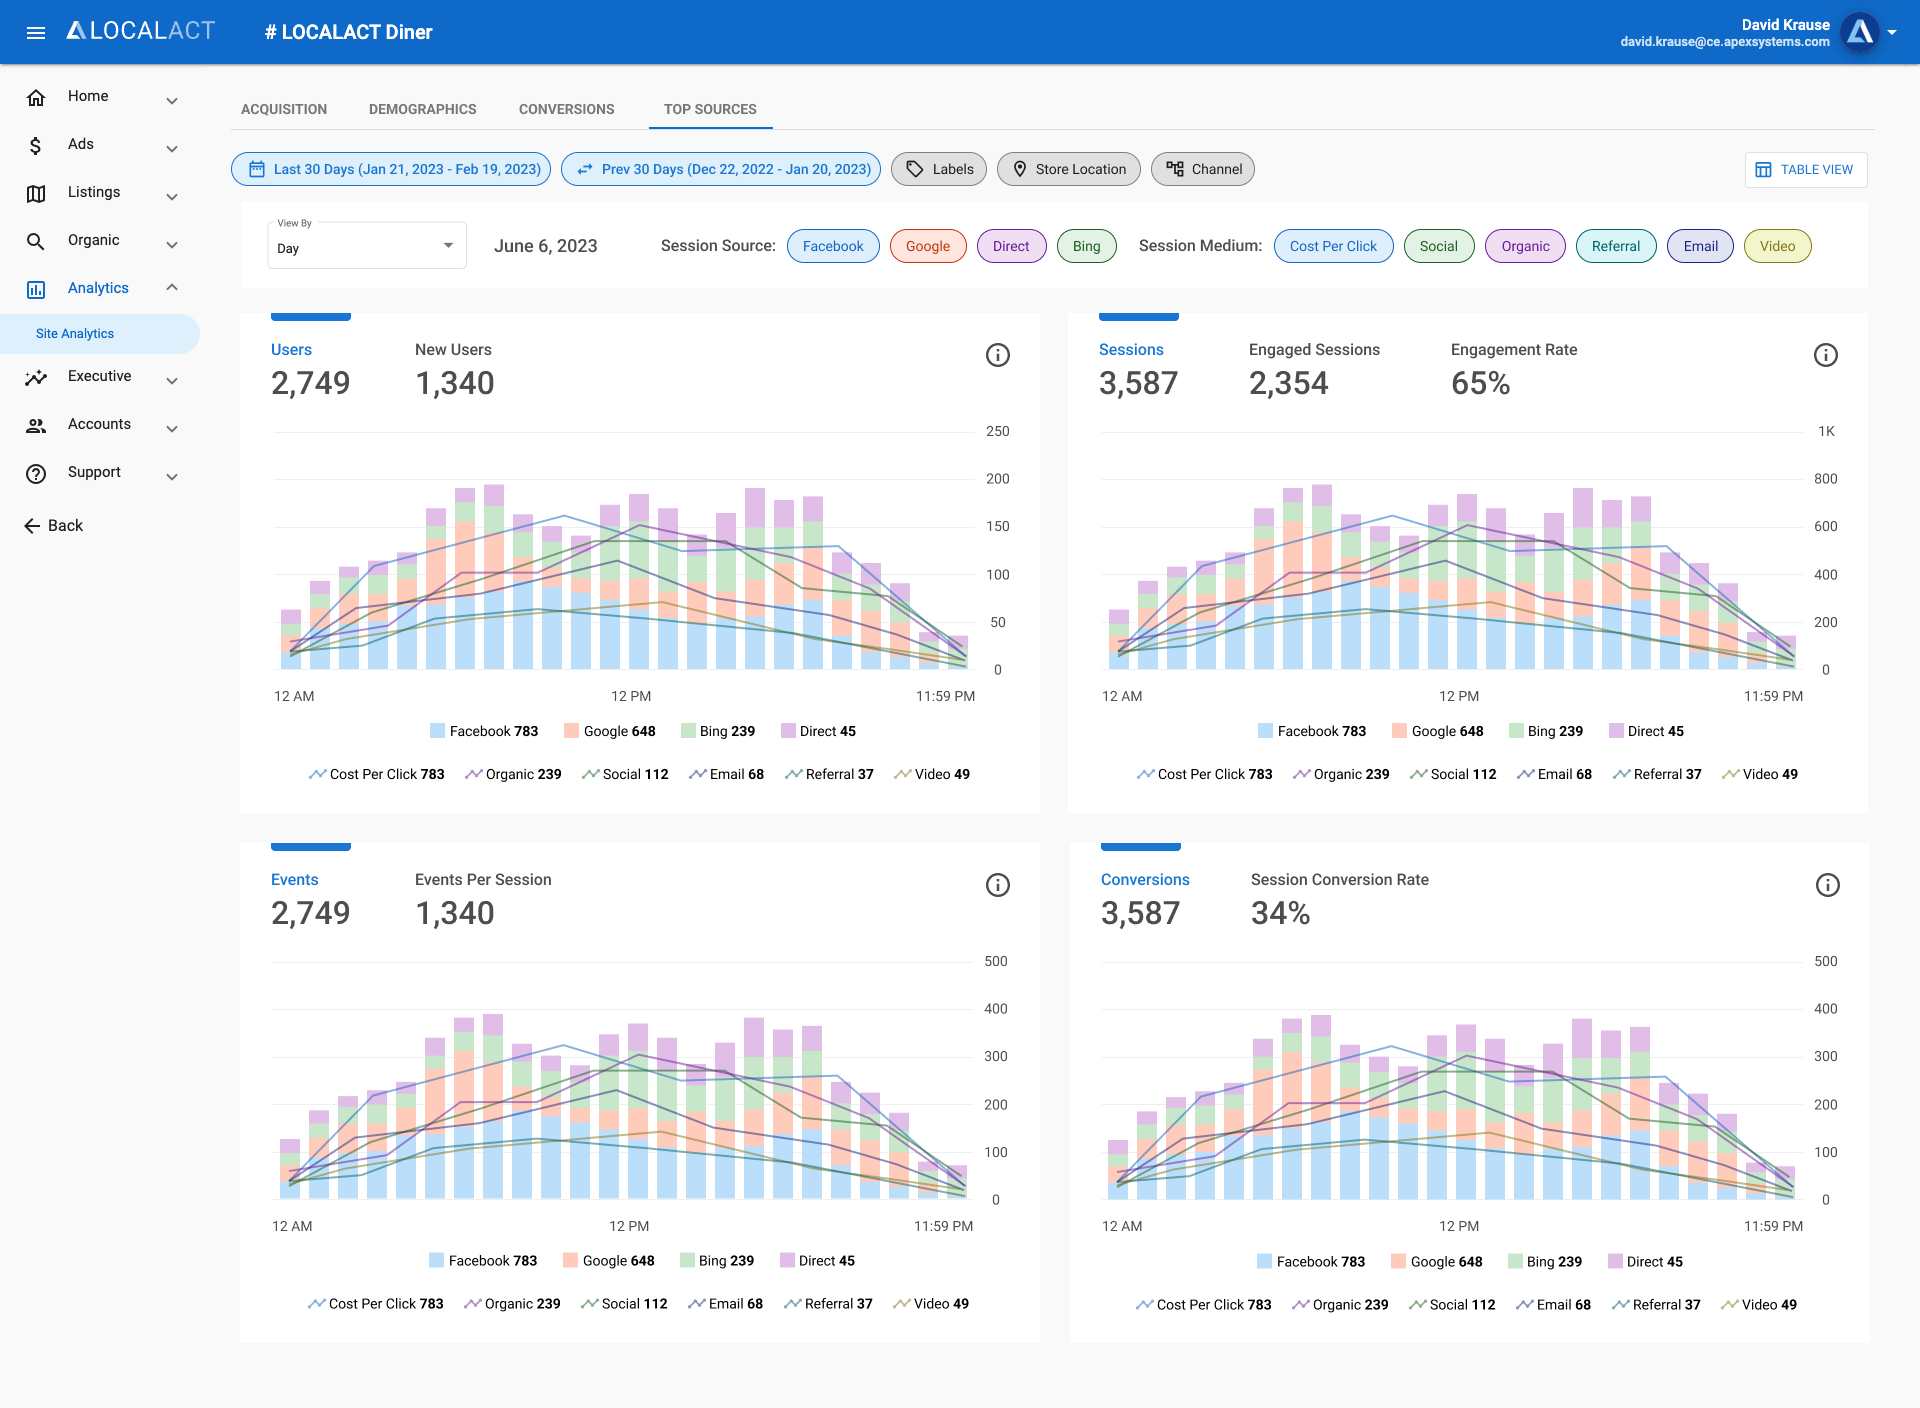
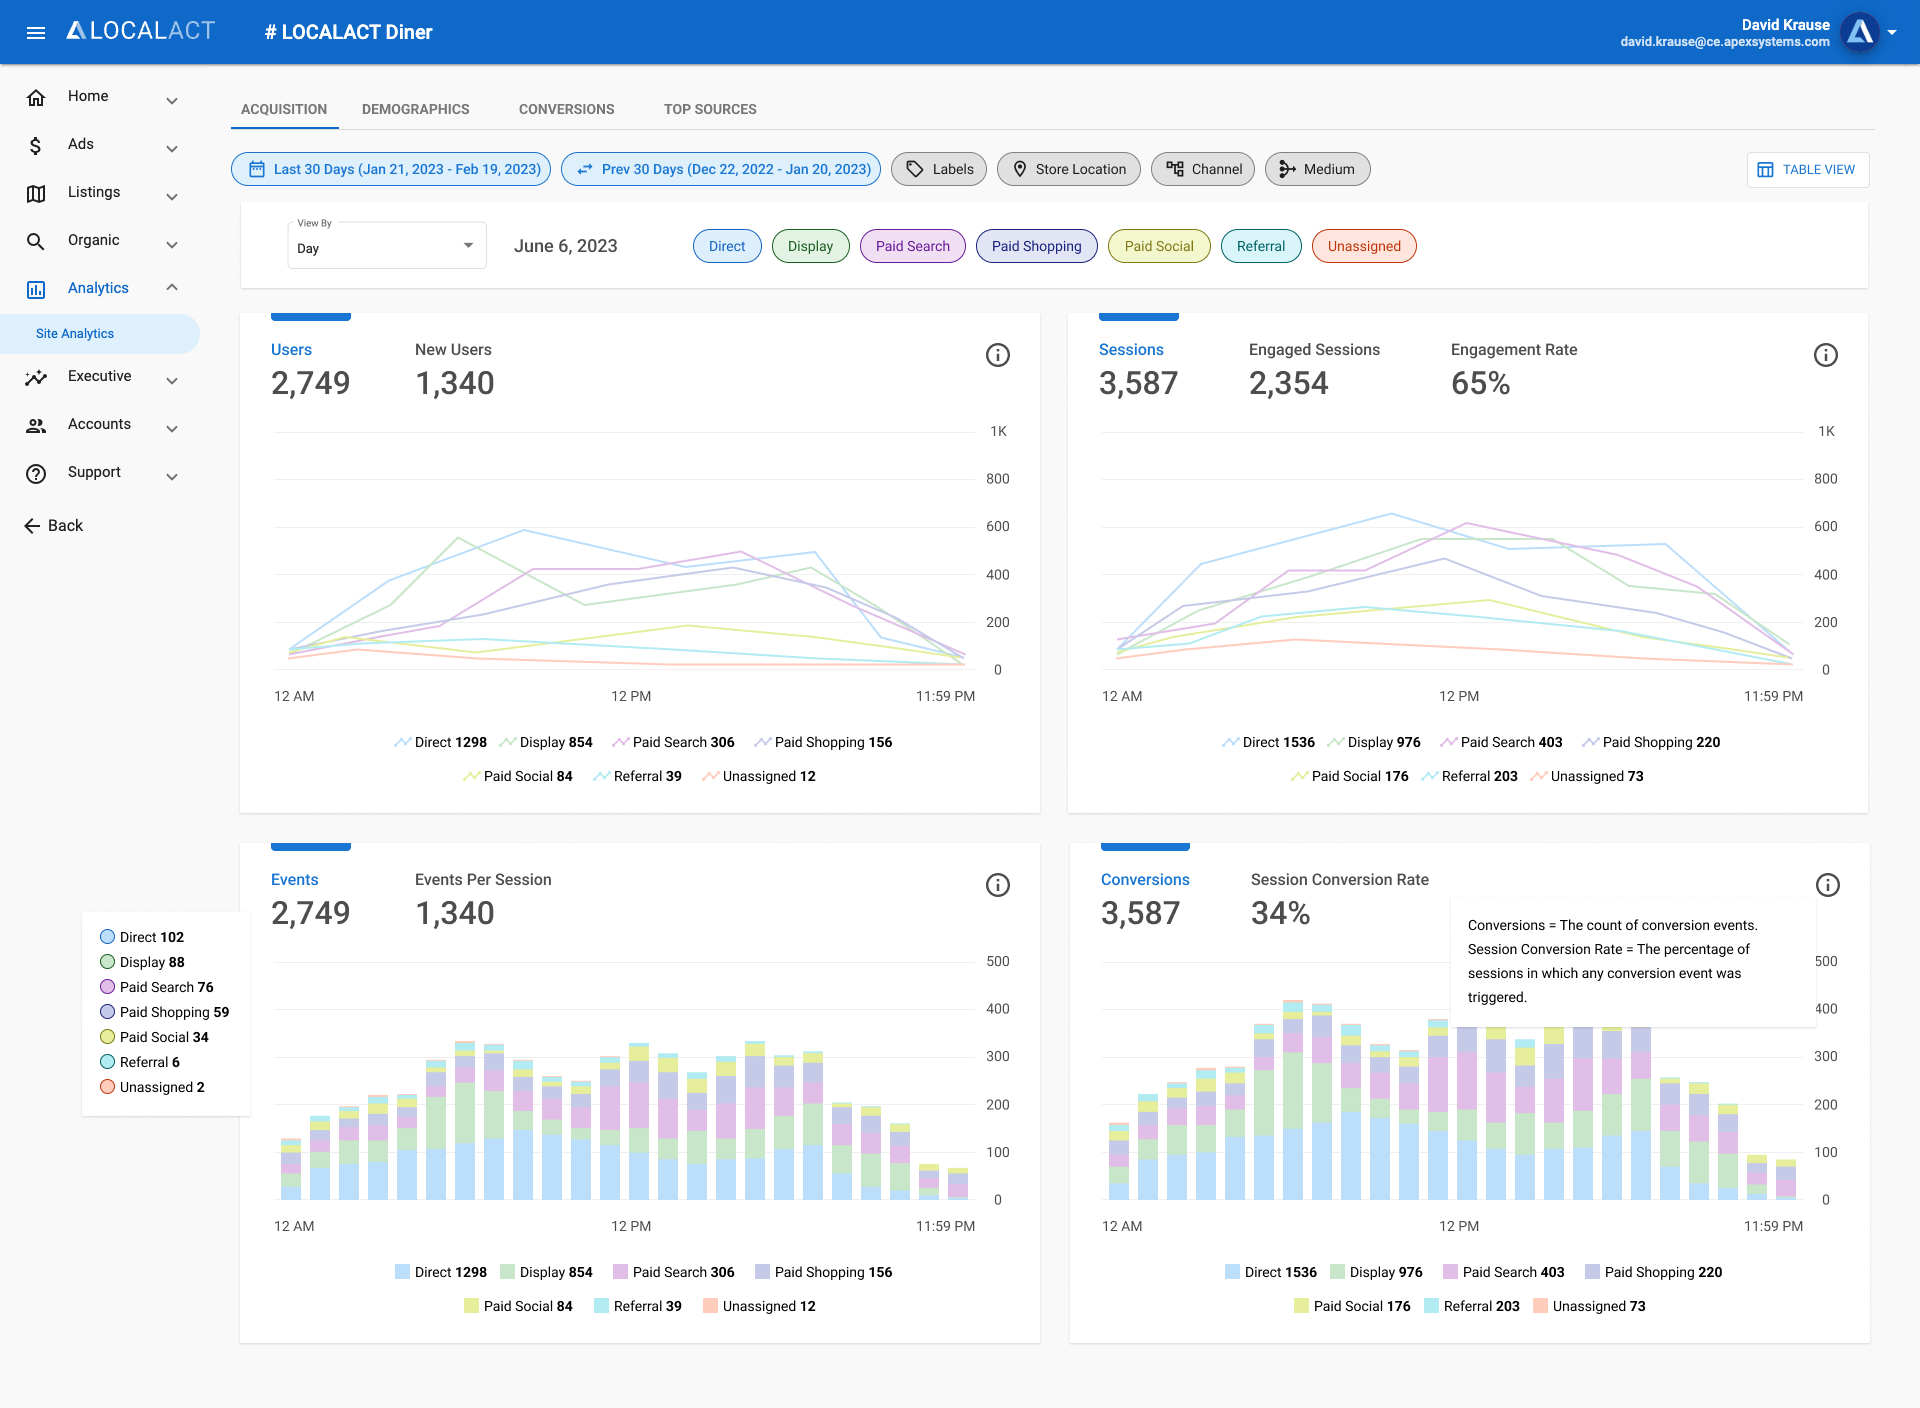
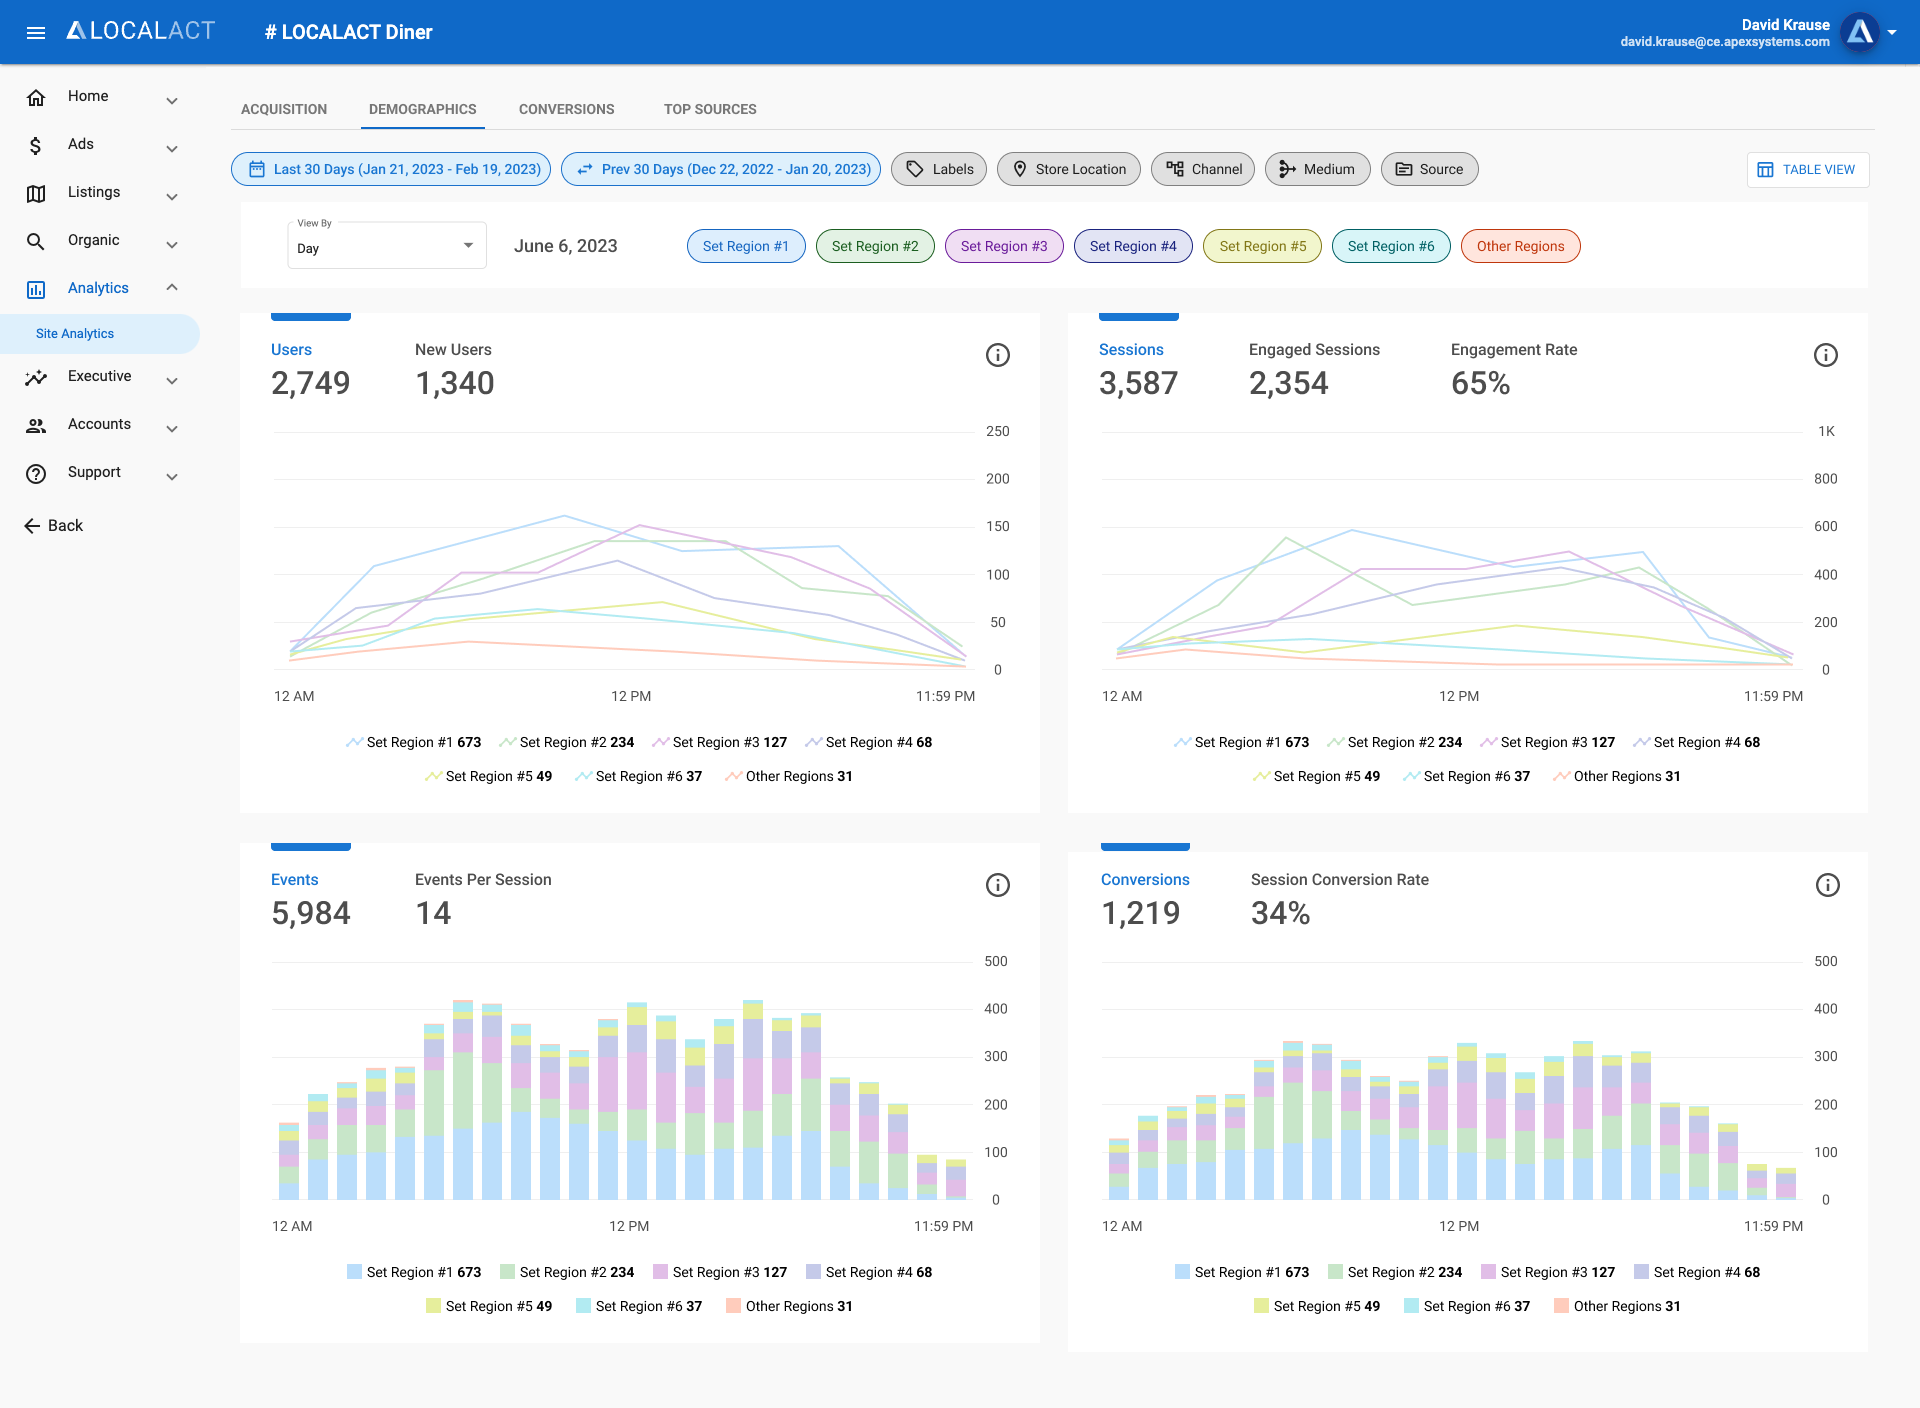
L3 engineers were planning to update to Google Analytics 4, which brought new API capabilities. I was tasked with designing new page templates within LOCALACT with new ways to visualize data and enable users to better understand important KPIs. These were high level, for future-use. Stakeholders would also be interested to see how it could implemented on the homepage.
Solution
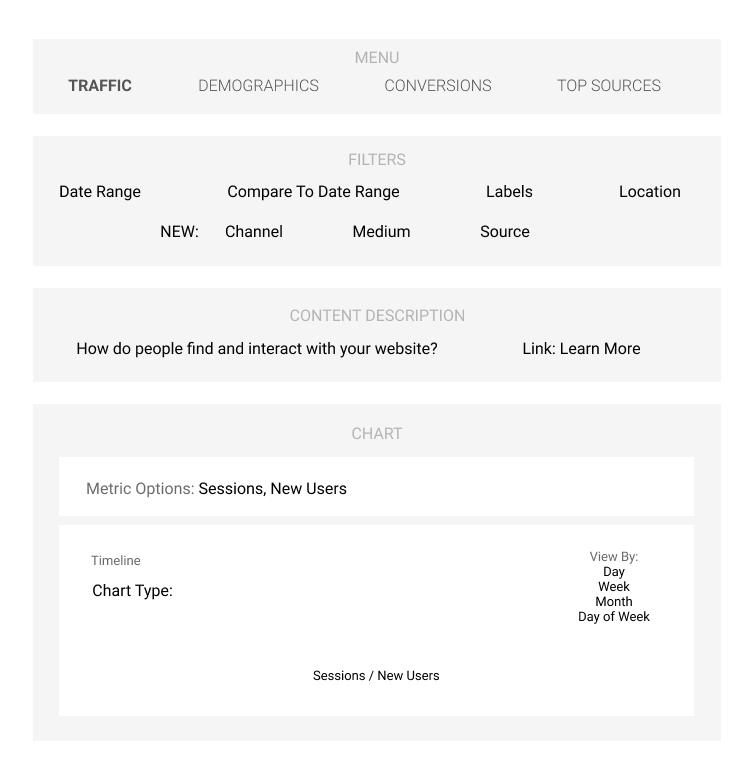
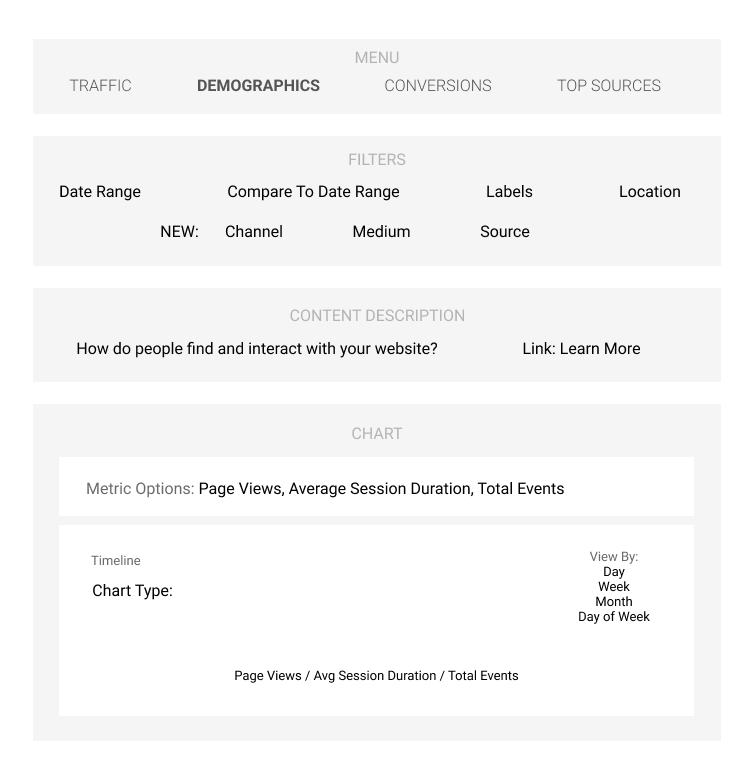
Once requirements were gathered, I began with wireframes to determine the basic layout and content of the pages. In tandem, I began creating surveys for stakeholders and specific user groups to better understand their needs and desires for this feature.
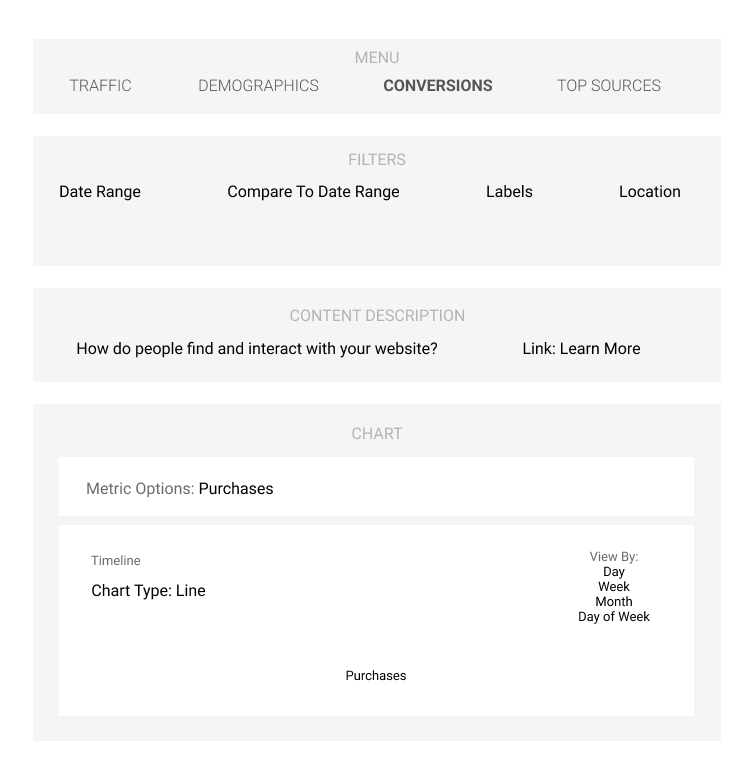
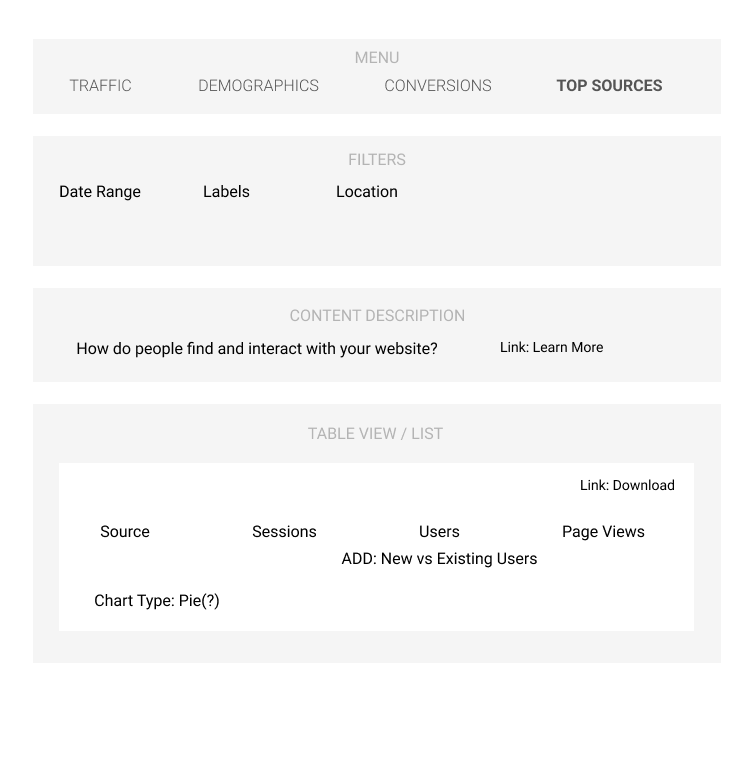
While designing, I researched GA4 capabilities to gain a deeper understanding of what this feature could be now and in the future. After working with stakeholders to finalize the details of these pages and a few rounds of design reviews, we agreed on a general design concept for these pages that would give the users an enhanced version of LOCALACT with a simplified introduction to Google Analytics 4.
Regrets
Not researching more Figma plugins to assist with data visualization designs. Editing many graphs/charts over several different pages and phases of design can be quite time consuming.
Lessons Learned
No overarching lessons from this one, but I learned a lot about designing for data visualizations and Google Analytics 4 that will come in handy in the future.

